Dashboards & Reporting
Transform complex data into clear, actionable insights with our unified dashboard experience.
What Is a Dashboard?
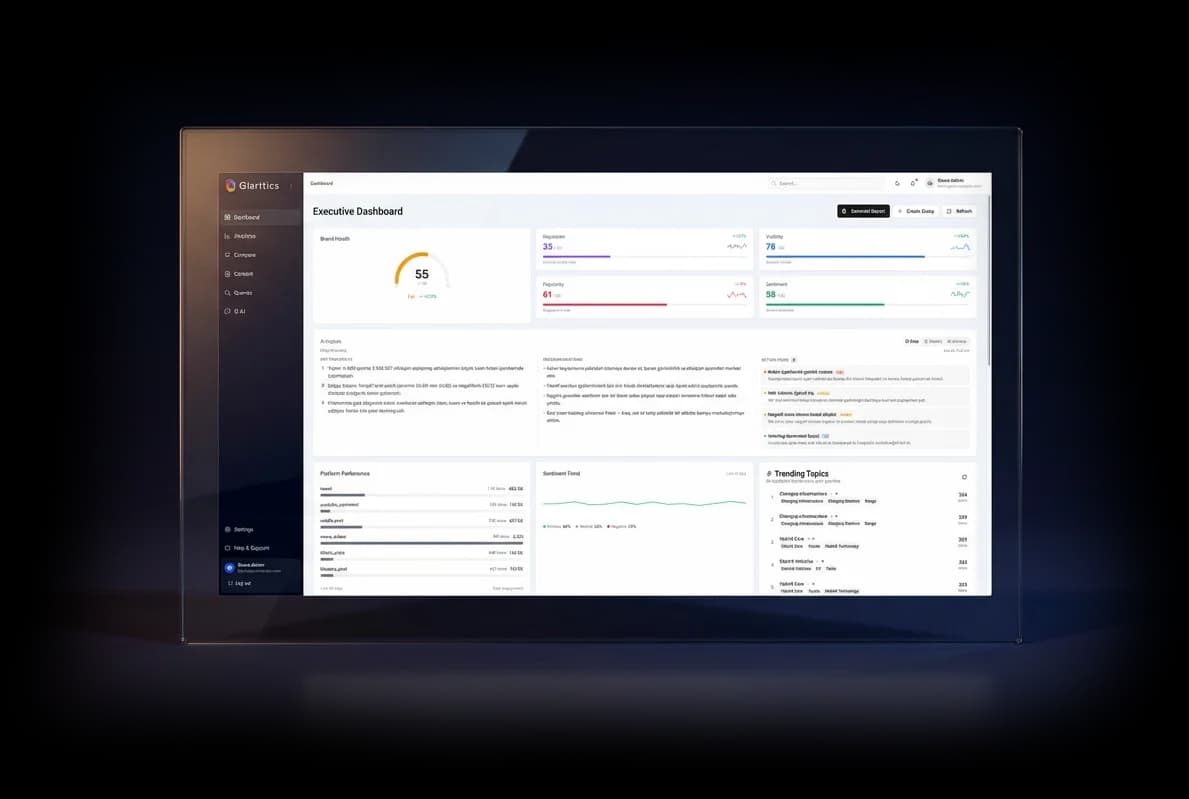
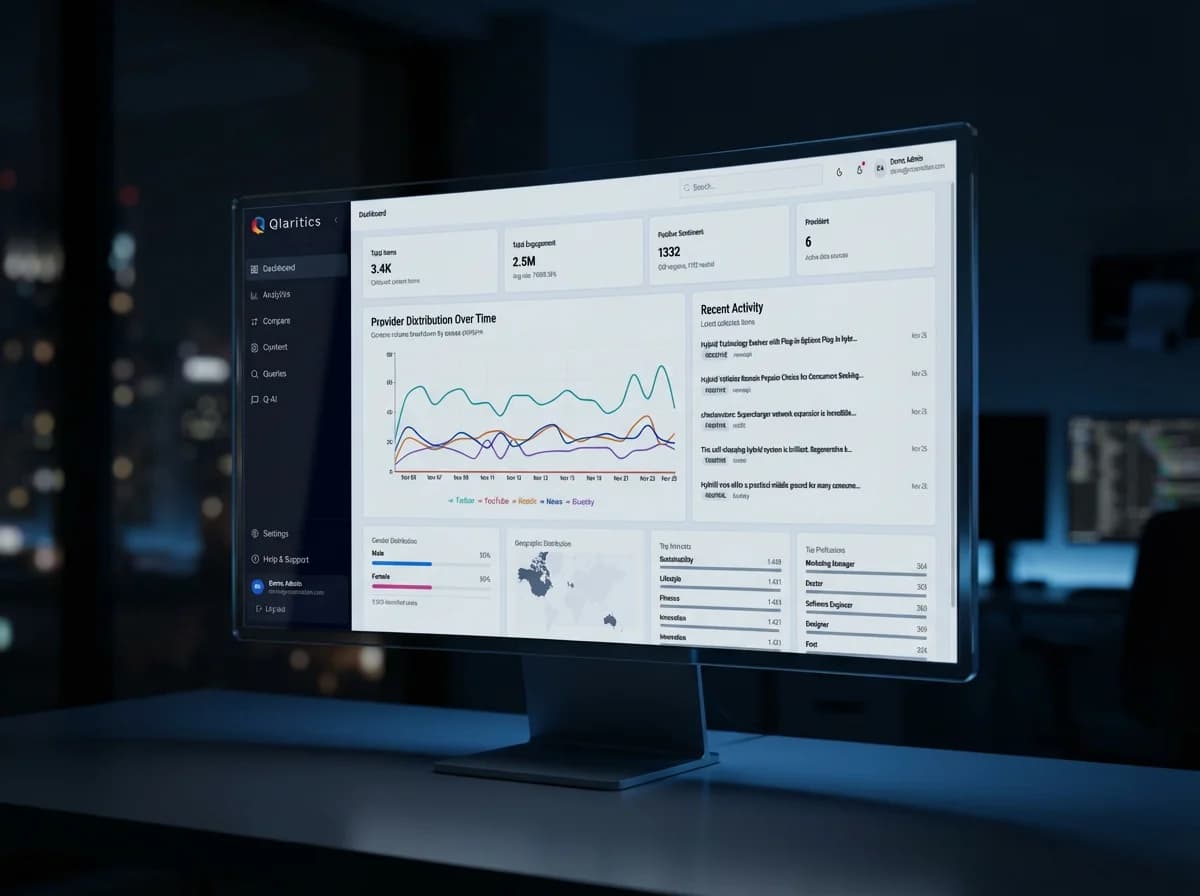
The Qlaritics Dashboard brings together all platform insights in a single unified view, displaying key indicators such as brand health, sentiment distribution, visibility, popularity, risk signals, and emerging trends in real time.
The dashboard does more than display metrics; it also provides AI-generated insights, risk alerts, and recommended actions through Q-AI.
This transforms the decision-making process from simple data observation into strategic intelligence.
Key Dashboard Features
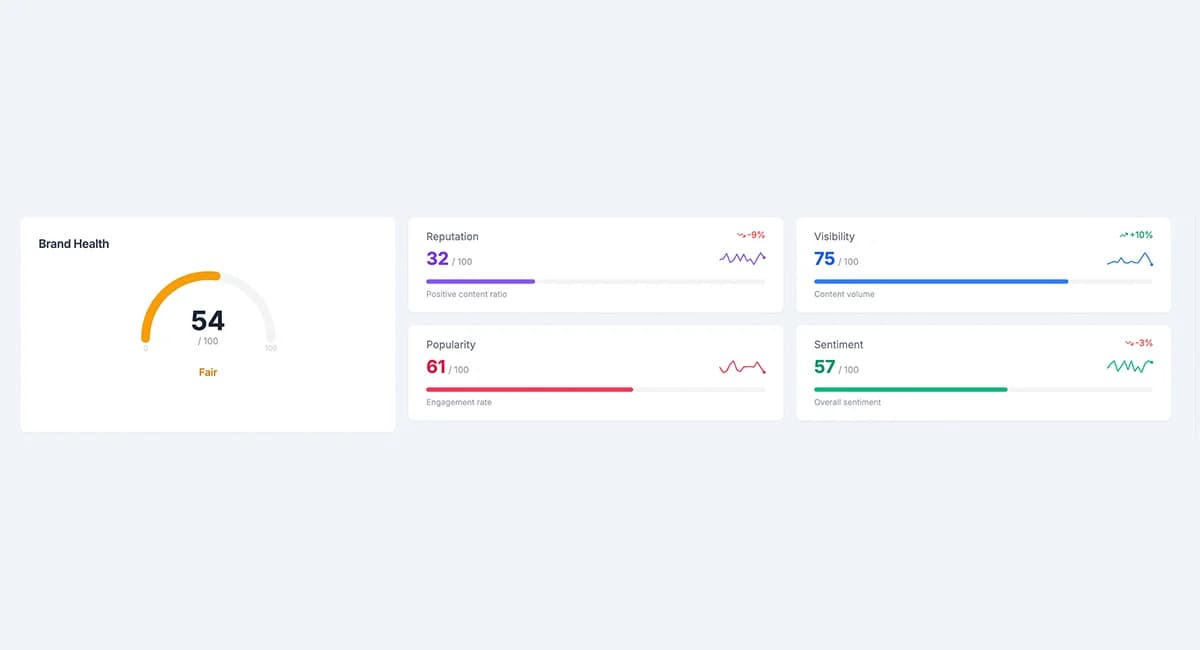
Brand Health Panel
Shows the overall state of your brand at a glance: sentiment balance, positive content ratio, visibility, and engagement quality.
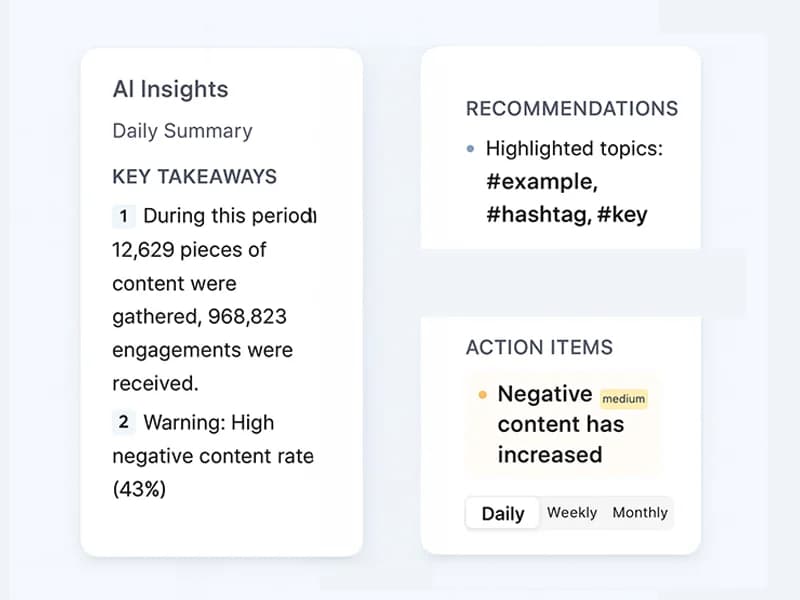
AI Insights
Daily automated summaries generated by Q-AI that highlight key events, critical findings, and recommended actions.
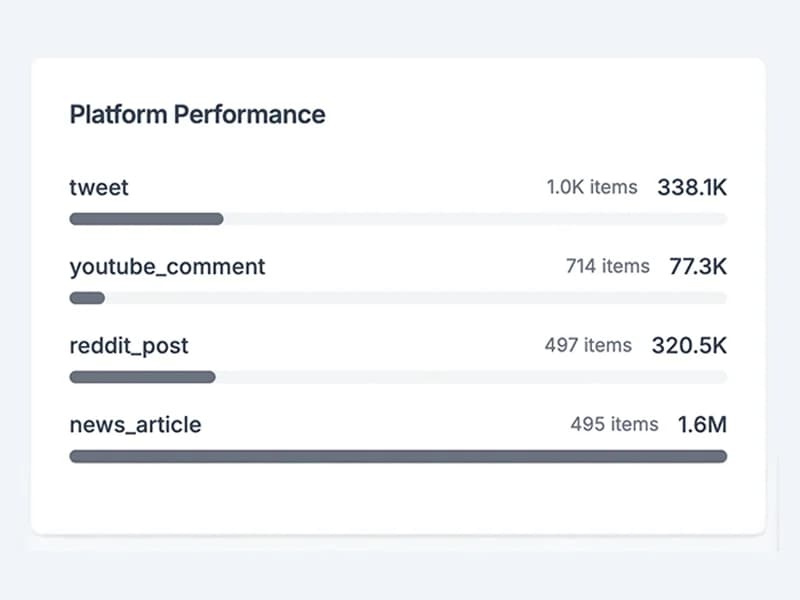
Platform Performance Distribution
Breaks down which platforms generate the most content and engagement. Displays real-time distribution across sources like YouTube, Twitter/X, Reddit, news sites, TikTok, and more.
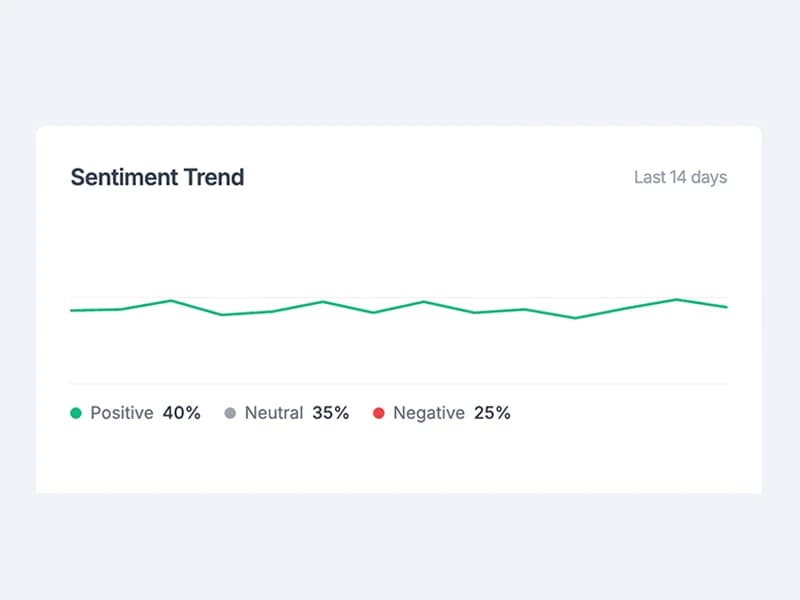
Sentiment Trend
Shows the direction of sentiment over recent days. Changes in positive, neutral, and negative sentiment help detect early signals of crises, viral potential, and emotional shifts.
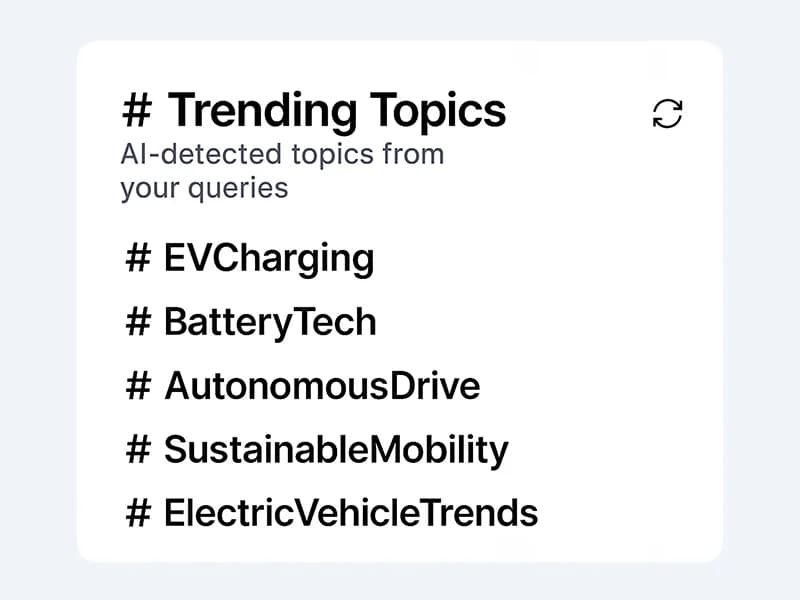
Trending Topics Panel
Displays rising topics automatically detected by Q-AI. Includes the communities discussing them, sentiment structure, and trend direction.
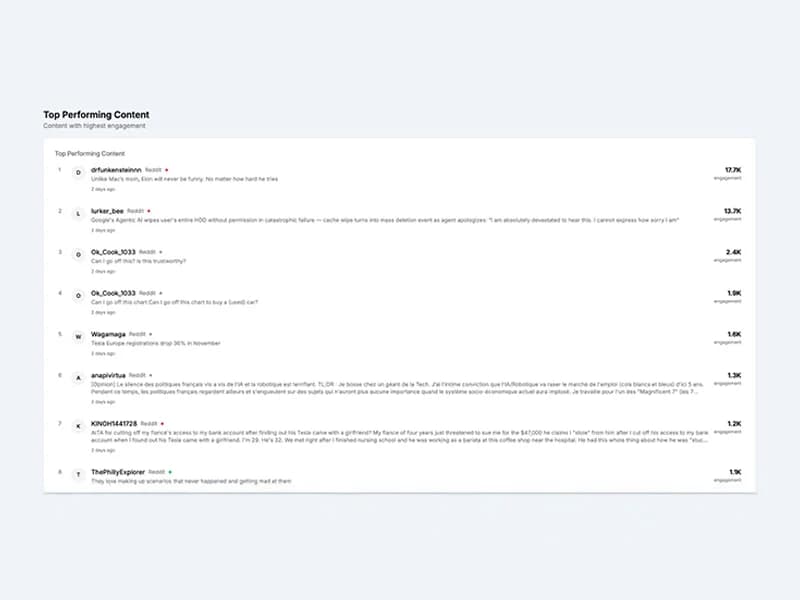
Top-Performing Content
Lists the content with the highest engagement. Can be filtered by brand, competitor, or topic category.
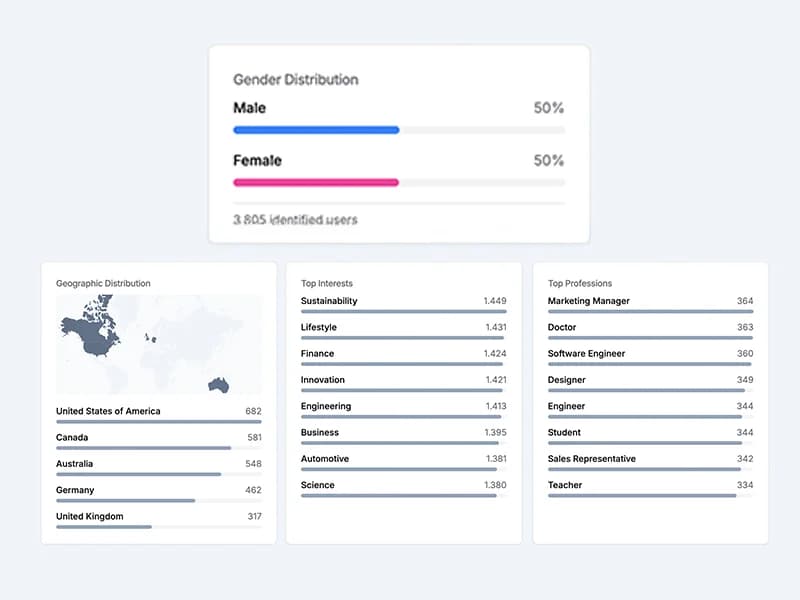
Demographics and Interest Profiles
Automatically analyzes audience profiles, showing gender distribution, geographic distribution, top interests, and professional segments.
Reporting Capabilities
Automated Report Generation
Generates detailed reports with a single click, including brand health, sentiment analysis, trend insights, risk analysis, competitor comparisons, and Q-AI interpretations.
Time-Based Reporting
Allows daily, weekly, or monthly report generation to examine trends, sentiment shifts, and performance changes.
Filter-Based Reporting
Reports can be customized by platform, sentiment, region, topic/hashtag, competitor, or community type.
Reports Enriched with Actionable Recommendations
Q-AI not only analyzes data but also recommends strategic actions based on detected patterns.