Comparisons
Analyze two queries, brands, or topics side-by-side, revealing differences, similarities, and behavioral dynamics in depth.
On a single screen, you can compare content volume, sentiment distribution, engagement metrics, timeline trends, keywords, user profiles, and much more.
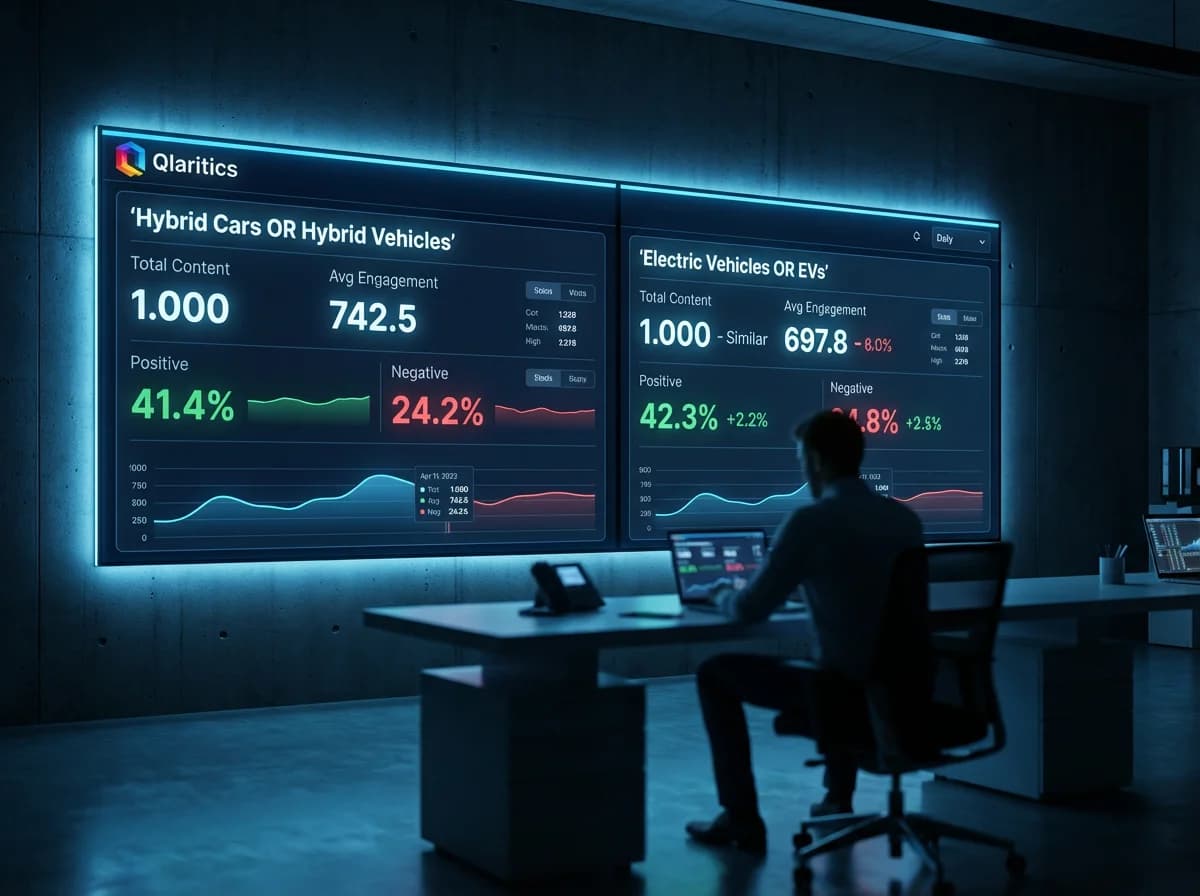
Query Selection & Overview Comparison
The user selects two queries, and the system displays: Total content volume, Average engagement, Positive / Neutral / Negative breakdown, Percentage change indicators. This section provides an instant high-level comparison of the two topics.
Timeline Comparison
Content volume of both queries is visualized over time. You can easily see when each topic rises or declines. Viral spikes, crisis beginnings, and trend shifts become clearly visible.
Sentiment Breakdown
Each query shows separate positive, neutral, and negative bars. This allows direct comparison of emotional reactions across audiences.
Emotion Analysis
Using Qlaritics' advanced emotion engine, the following emotions are compared: Joy, Anger, Surprise, Fear, Sadness, Disgust, Neutral. This section highlights how different communities emotionally respond.
Engagement Metrics
For each query, Qlaritics shows: Total likes, Total shares, Total comments, Total views, Viral content count. This helps determine which topic receives stronger engagement.
Top Engaging Posts
Shows the highest-engagement posts for each query individually. You can instantly see which content shapes the conversation.
Top Keywords & Topics
Displays the most frequent keywords and topic clusters for both queries. This reveals the thematic structure behind each conversation.
Most Active Users
Lists the users generating the most content or interaction for each query. You can identify who drives the discussion.